Panopto offers detailed statistics about how your videos are being used.
This can help you assess students' engagement with course materials.
Please note that Panopto calls each individual video a "session".
- In your course's Canvas site, click on Class Recordings.

- When the Class Recordings area opens, click the
 icon near the top right corner to analyze all of the videos posted for this course or click on the folder of content that you would like to analyze.
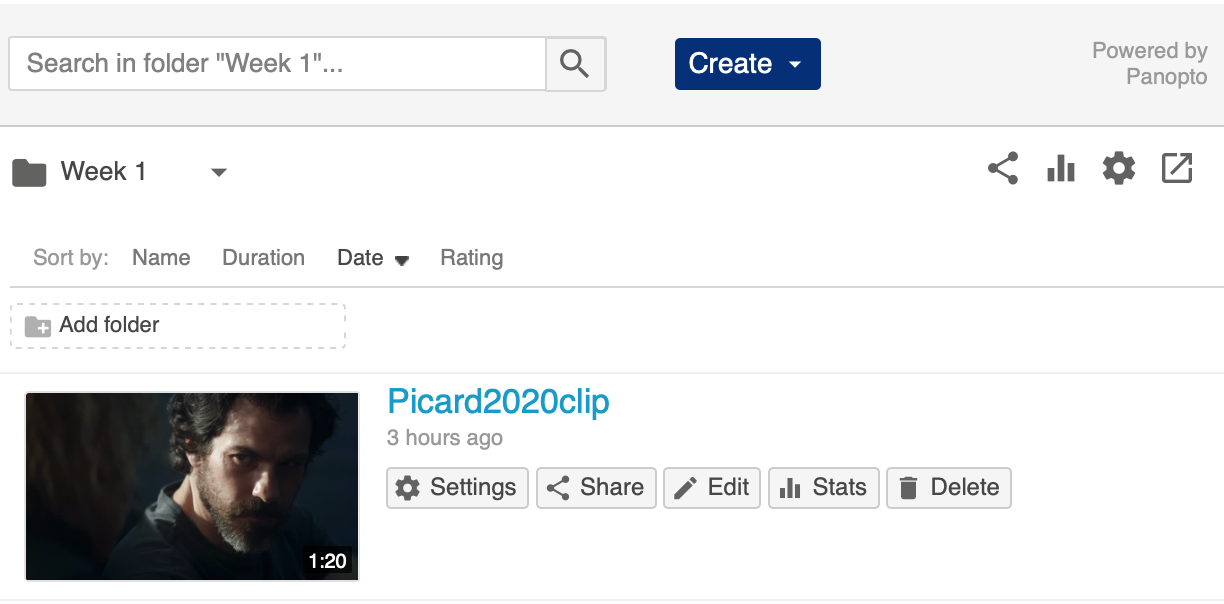
For this example, we'll click on the "Week 1" folder.
- At any point where you see one or more individual recordings listed, you can hover your mouse near them, and you will see a group of options appear. You can click on the
 icon to see the statistics for that individual recording.

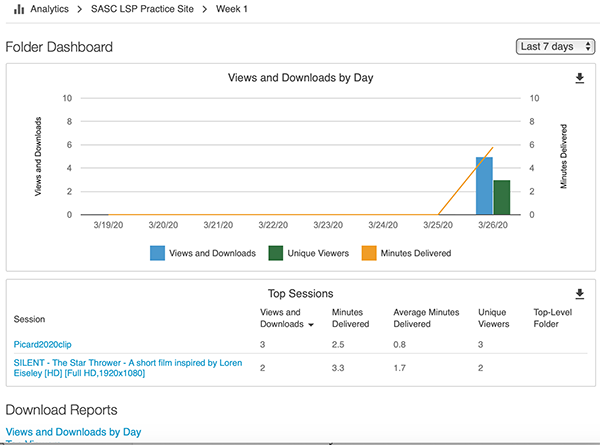
Once again, we can click on the  icon to view statistics for this folder as a whole. After you click that, you'll see a chart showing the number of views, unique viewers, and minutes delivered. Below that is a breakdown for each of the top sessions (most frequently viewed videos) showing the views per day, the total minutes of video that were watched, and the average time of viewing for each video within the folder.

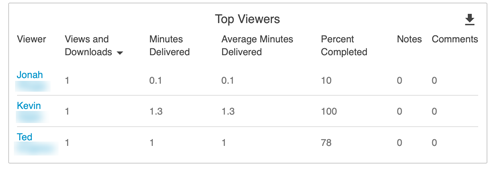
If you click on the name of one of the videos in Top Sessions, you can see details for students who have watched the video the longest; click See All to reveal the full list of everyone who viewed the recording. Here, Kevin watched the whole video, Ted watched most of it, and Jonah only watched 10 percent of the video. None of the students added notes or comments to the video.

At the bottom of the page, you'll see "Download Reports". The User Completion report provides a spreadsheet for every viewer's accesses along with the last view time, the minutes delivered, and the percent completed for each viewer.

 icon near the top right corner to analyze all of the videos posted for this course or click on the folder of content that you would like to analyze.
 icon to see the statistics for that individual recording.


 ARTS & SCIENCES COMPUTING